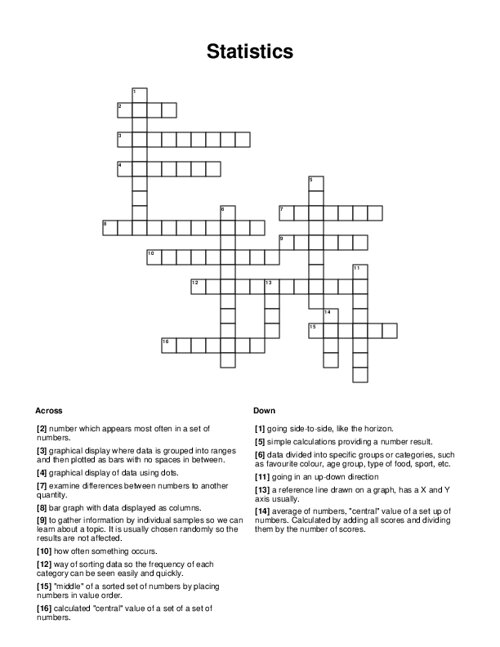
Statistics Crossword Puzzle
QUESTIONS LIST: axis: a reference line drawn on a graph, has a x and y axis usually, horizontal: going side-to-side, like the horizon, vertical: going in an up-down direction, survey: to gather information by individual samples so we can learn about a topic. it is usually chosen randomly so the results are not affected, categorical: data divided into specific groups or categories, such as favourite colour, age group, type of food, sport, etc, numerical: simple calculations providing a number result, compare: examine differences between numbers to another quantity, two-way table: way of sorting data so the frequency of each category can be seen easily and quickly, dot plot: graphical display of data using dots, histogram: graphical display where data is grouped into ranges and then plotted as bars with no spaces in between, column graph: bar graph with data displayed as columns, frequency: how often something occurs, mean: average of numbers, "central" value of a set up of numbers. calculated by adding all scores and dividing them by the number of scores, average: calculated "central" value of a set of a set of numbers, median: "middle" of a sorted set of numbers by placing numbers in value order, mode: number which appears most often in a set of numbers.